MongoDB IO performance
It was not the first time that we saw the problem, and it was not the first time that we cannot figure out what was creating the error. But today, I want to share the experience.
A little bit of the history, our production system is a replica set of three nodes. When the issue is happening our system responses slow, in such situation what you feel is that the web is down, because you don’t receive answer in quite some time for some requests.
You know that the system is fixable easily because after you restart the node involved you get the system up and running normally again. The problem is that you have to delete all the data in the replica affected, and start a synchronisation from scratch. The first time was happening in the master node, the last day was happening in the slave node (a different machine).
Something good was that the last day when it was happening we was testing Newrelic and we got new information, not so much but something more. Some pictures that I have extracted from our Newrelic monitoring:
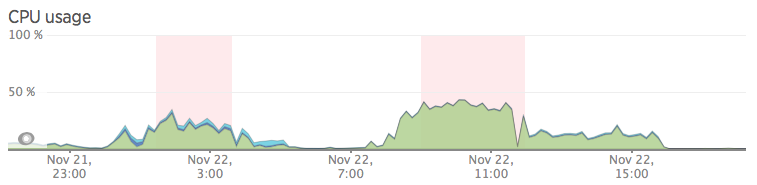
The CPU in use is growing a little in the point of the peaks:
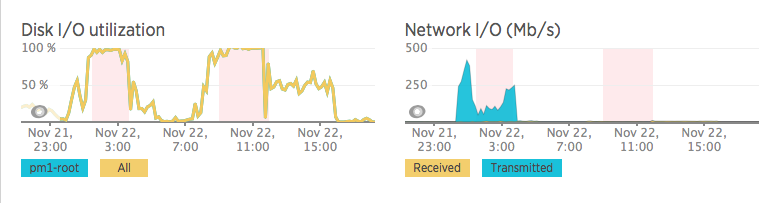
But the real problem is the disk IO (not the network IO, as you can see in the pictures):
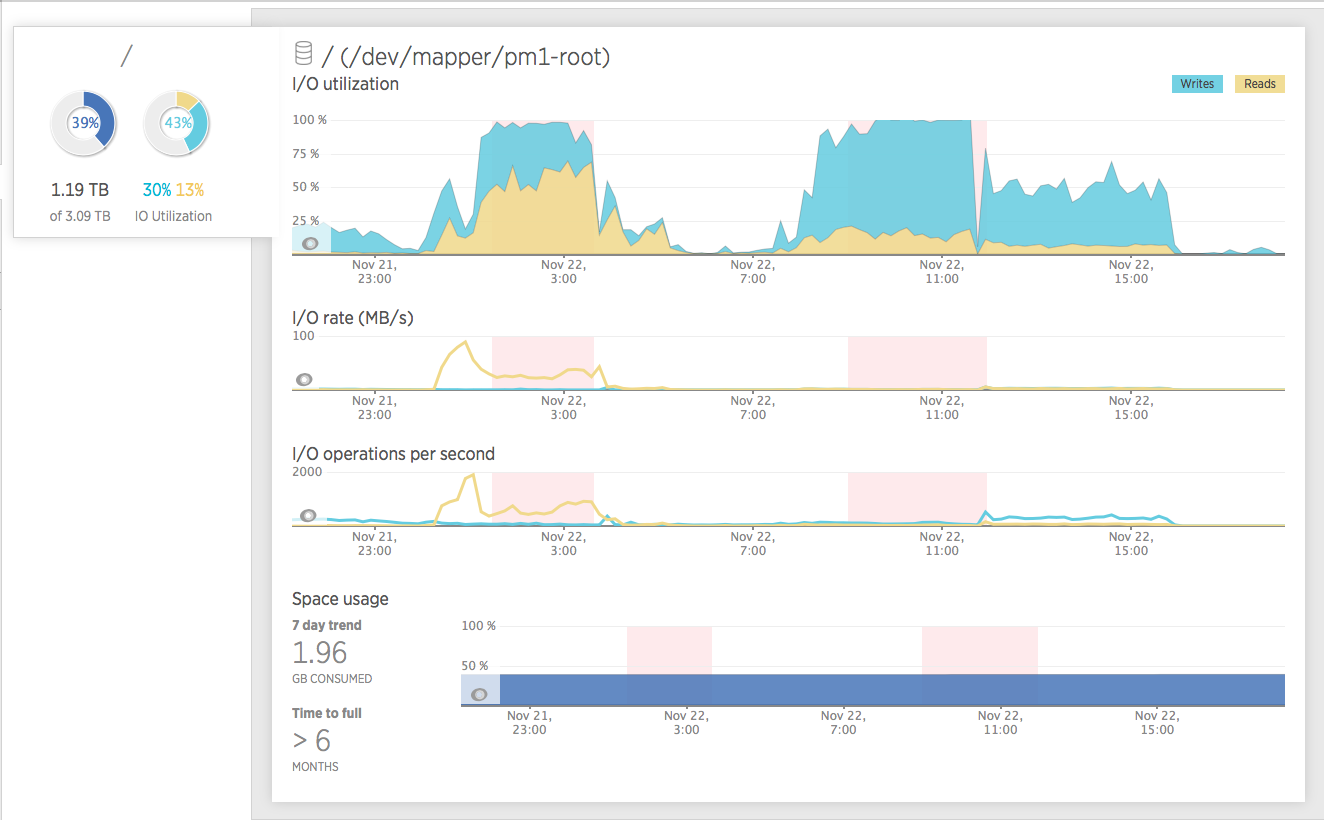
Here, there is a better graph about the problem with the IO and you can see that the writes was increasing in that time like the hell, using the 100% of the IO in the hard disk.
We don’t know the real reason, at the moment of write this post. Although, there is an old issue (fixed in 2.5.0), when mongod flushs the working memory to disk, it was having this particular problem.
I would like to write down all the things that we know in this point, maybe it will help us to find a solution in some point and clarify our theory of the “flushing data”:
- There was not so much users in that time in the website. The traffic and/or the consequences of that is not creating the issue, as far as we can see.
- The issue was appearing when the system is not doing so much things. It is not the most relaxed time of our MongoDB infrastructure, but there is not so many things going on in that particular time.
- The number of connections was growing from ~150 to 2000.
- The response times in the queries was growing to seconds ~20s or more
- If you create a graph with the response times of the collections, there is a log about “flushing data” (we use MMAPv1)
015-11-22T10:07:45.645+0100 I STORAGE [DataFileSync] flushing mmaps took 426819ms for 615 files
2015-11-22T11:13:31.755+0100 I STORAGE [DataFileSync] flushing mmaps took 429132ms for 615 files
- The node is still working for the master, but really slow for queries. It makes the web to be blocked because the driver doesn’t see the node down and it continues sending request to it.
- There was one of the web nodes that was using all the heap memory in that particular period of time, and going back to normal after we fix the problem with node.
- Something bad about the monitoring is that currently the instrumentation is not working for our version of MongoDB, that is because I cannot connect the web nodes with the database and add more information about the issue.
We have tested the performance of the hard disk from the linux side and from the mongo side and we didn’t achieve any clue about what it’s wrong. Our results were successful in both case.
For the time been, we have switched the storage type from MMAPv1 to WiredTiger, to see if there is a different behaviour, in theory it should not flush data from memory to disk in that way.
If you have any suggestion, we have posted the same information in the MongoDB user group. Or write a comment here :).